
Police areas ranked by pedestrian casualties
| Report by Pedestrian Safety www.pedestriansafety.org.uk | Published September 2016 |
For charts of the latest road casualty information by police area, see here
Summary
There is a wide variation between the serious casualty rates for pedestrians (all ages), with the worst police areas having rates 50% above the national average, and over double the rates in the best areas.
For child pedestrians, the variation is even wider, with a three-fold variation between the best and the worst police areas.
In this reportSection 1: Pedestrian casualties - all ages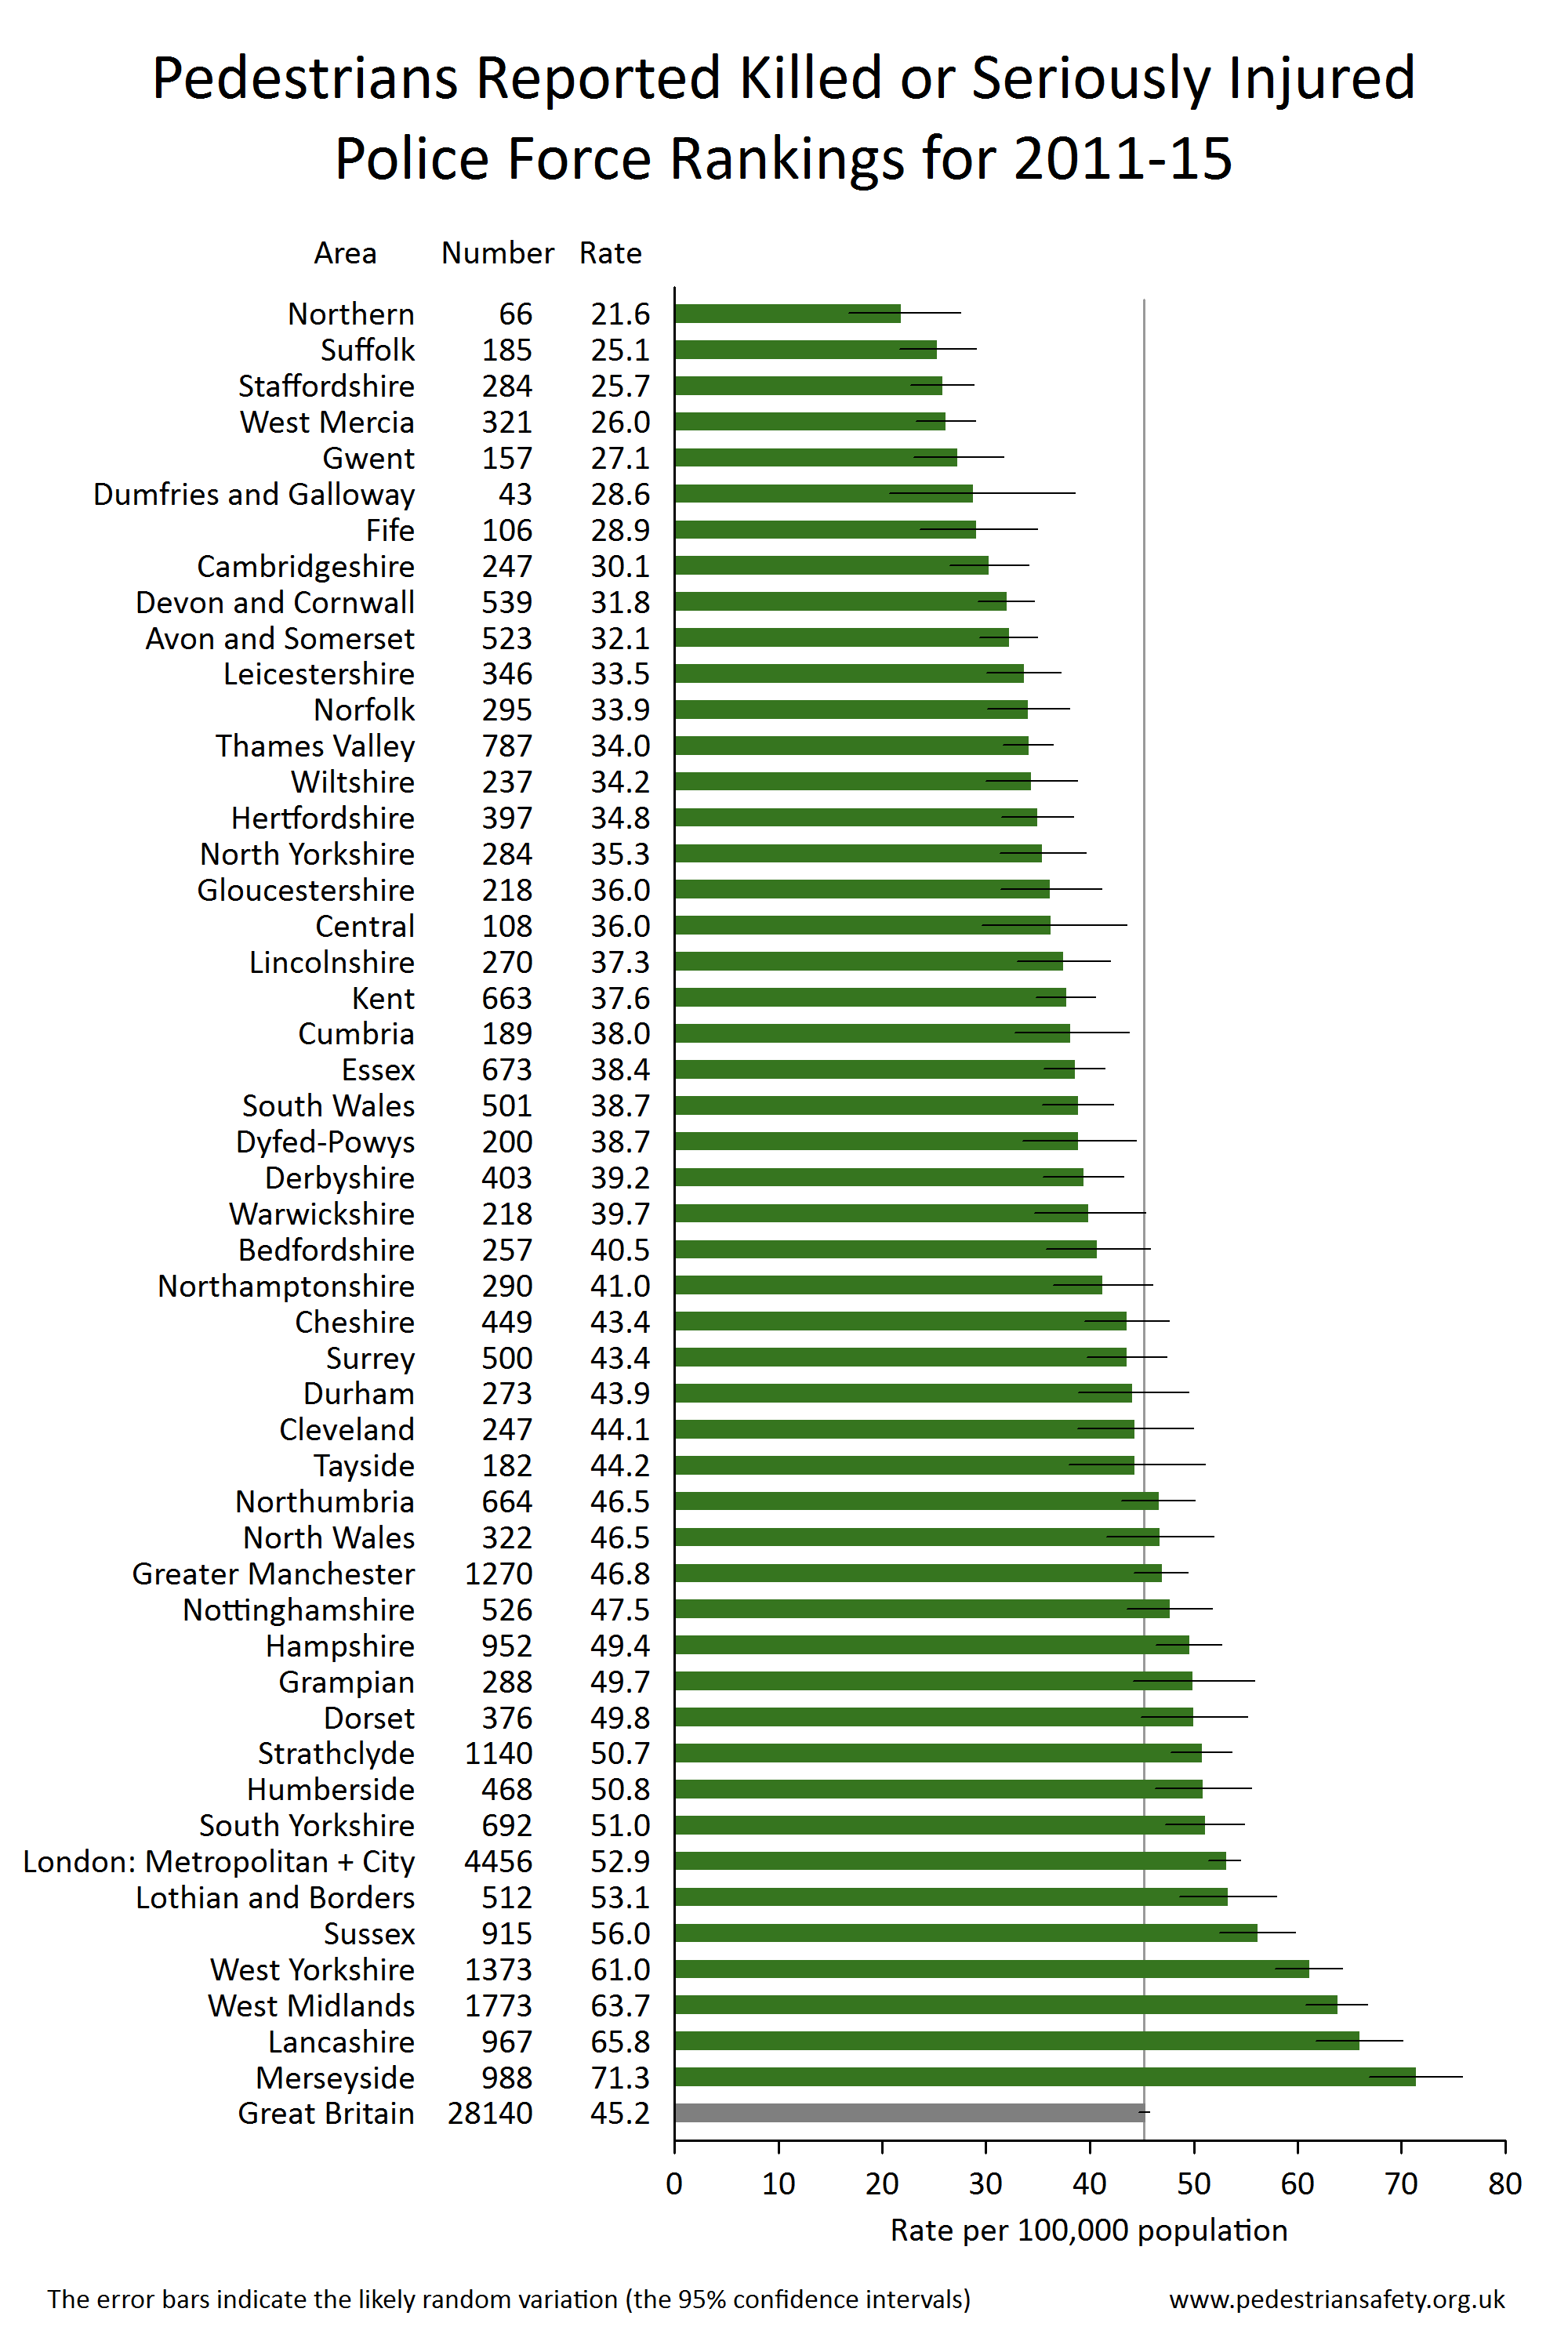 Section 2: Child pedestrian casualties 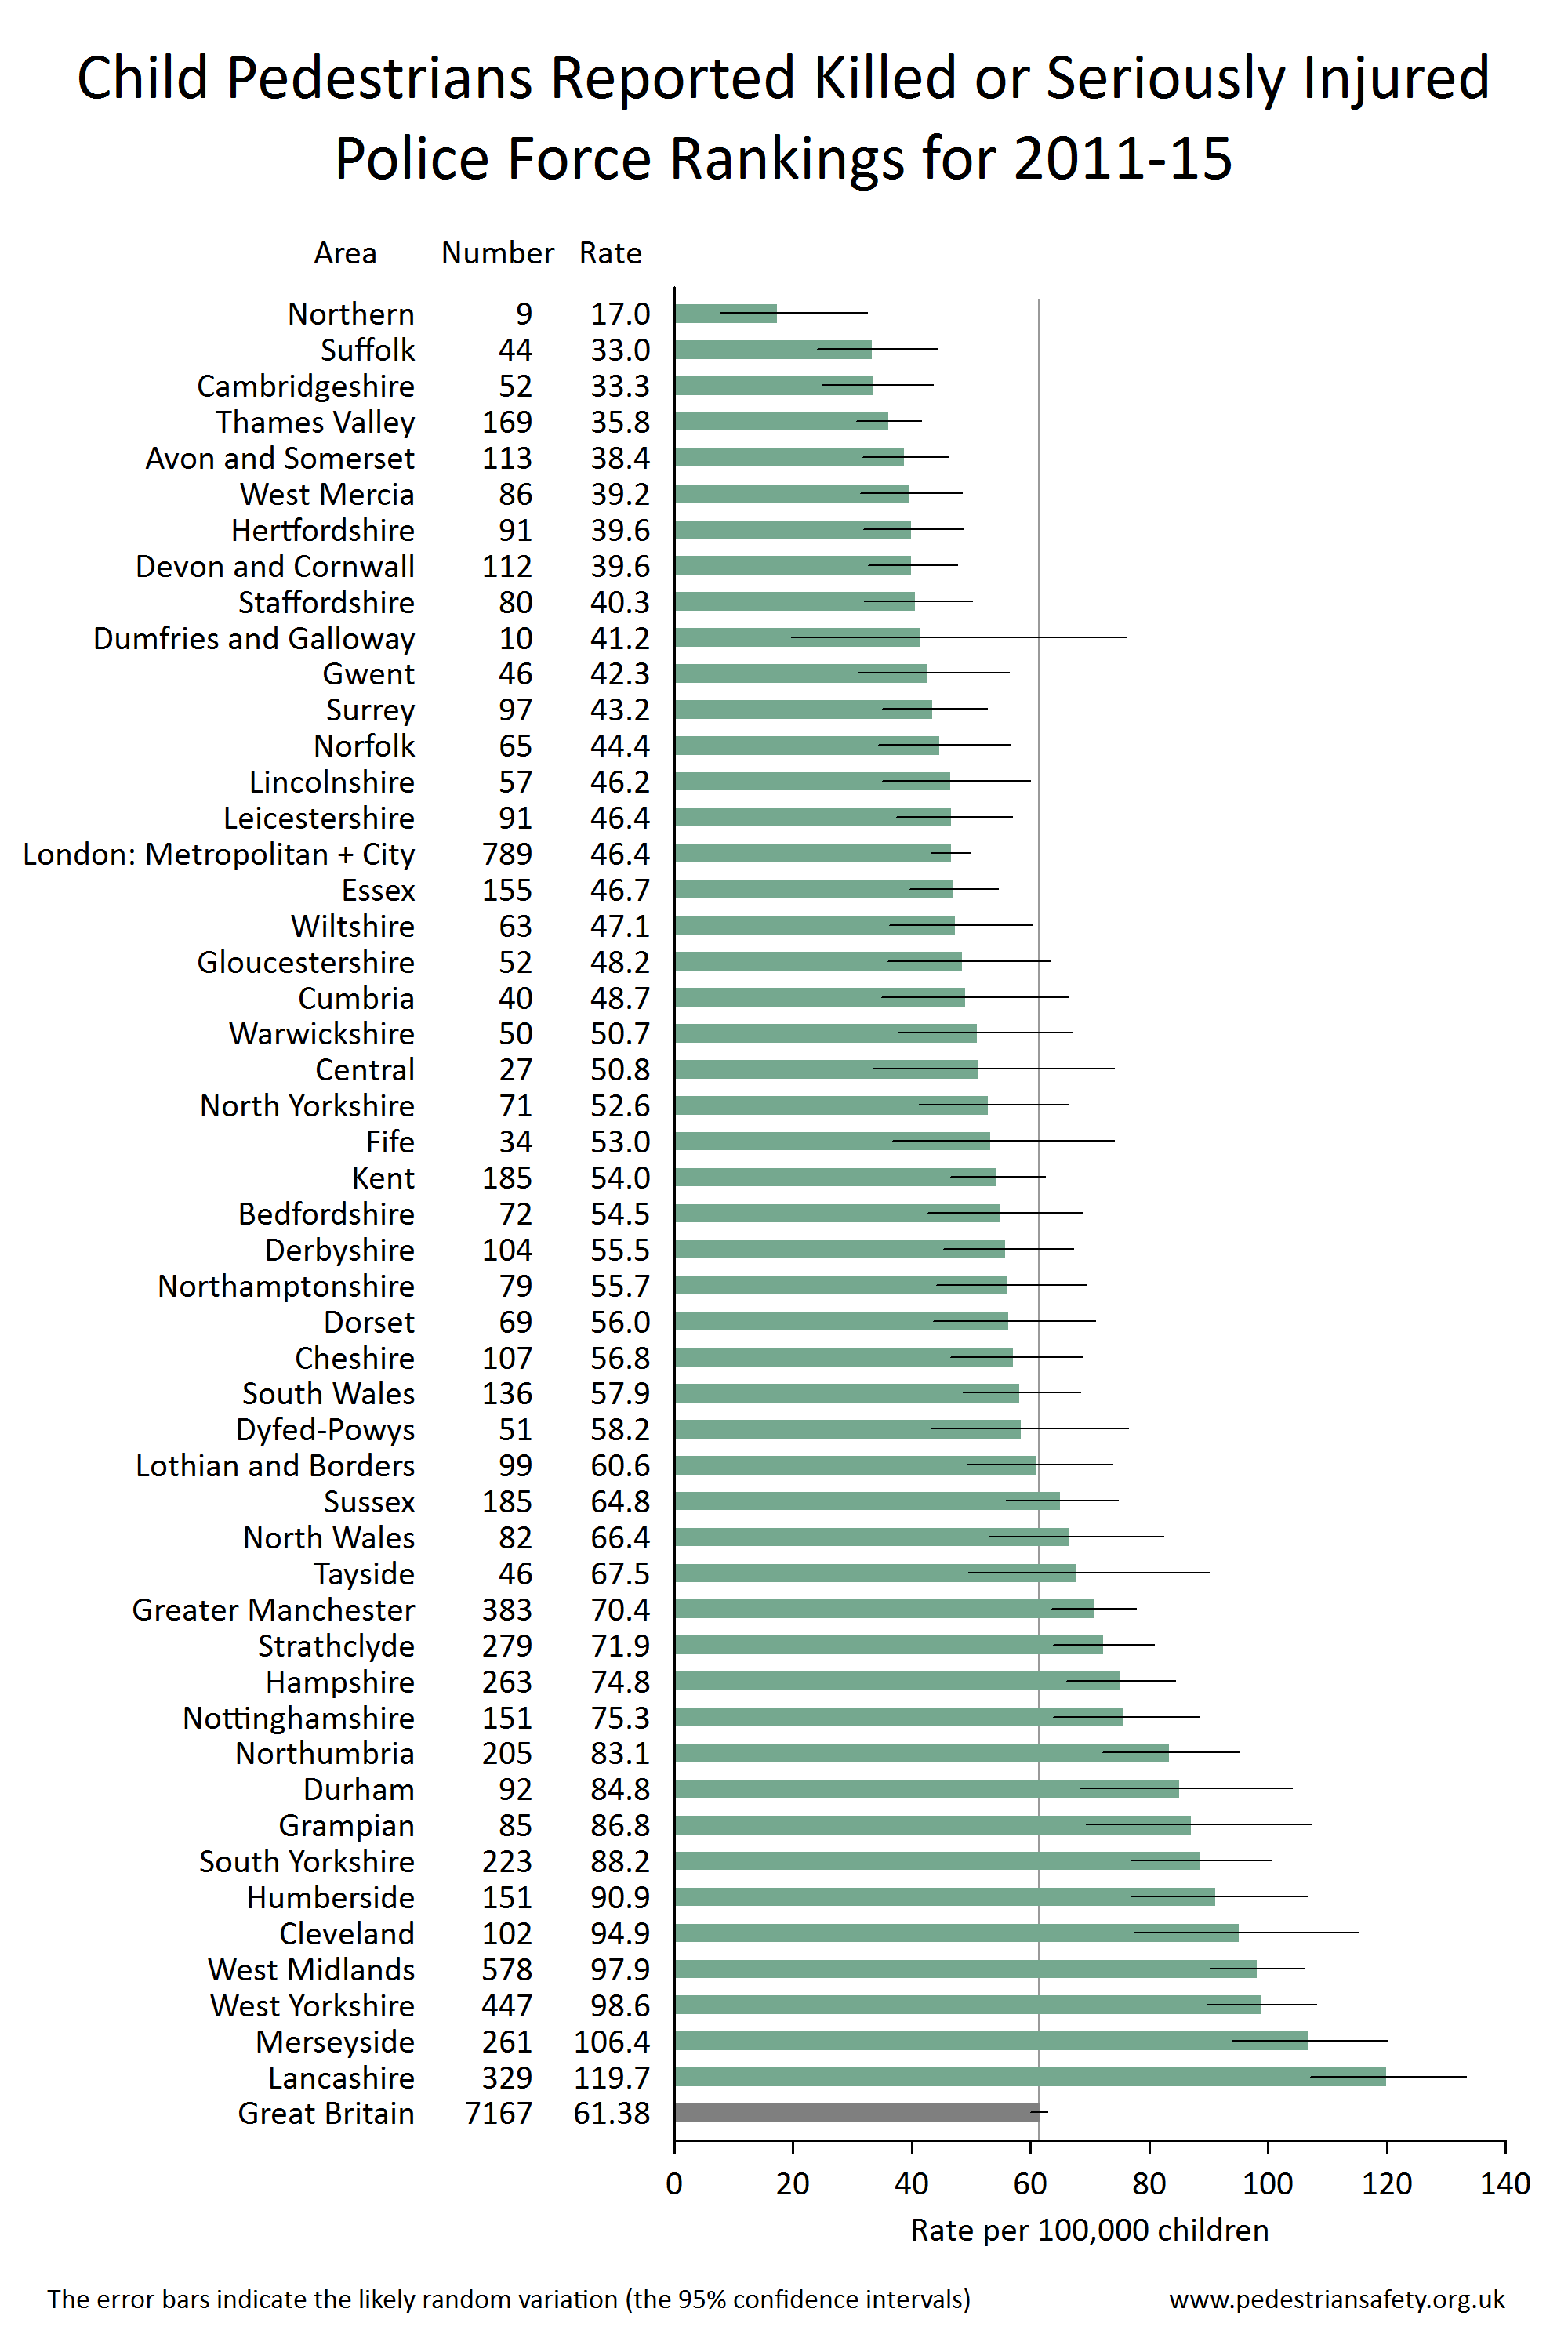 Section 3: Sources and notes | This report gives a comparison of serious casualty rates for the different police areas in the UK for (a) pedestrians of all ages, and (b) child pedestrians. It is derived from the DfT database of reported road casualties. The rankings are according to the rate of reported killed or seriously injured (KSI) casualties per 100,000 population (or per 100,000 children respectively) for the five-year period of 2011-15. 'Children' includes the age range of 0 - 15 years. More details are in Section 3.
| ||||||||
1. Pedestrian casualties - all ages
2. Child pedestrian casualties
'Children' include the age range of 0 - 15 years.
3. Sources and notes
These analyses were derived from the DfT database of road collisions, casualties and vehicles (the police/DfT STATS19 database).
The data can be viewed in spreadsheets published by the DfT in .xls format, see https://www.gov.uk/government/uploads/system/uploads/attachment_data/file/10184/ras30043.xls - or download from here.
The population data was taken from Population Estimates for UK, England and Wales, Scotland and Northern Ireland, Mid-2013 published by the Office for National Statistics http://www.ons.gov.uk/ons/rel/pop-estimate/population-estimates-for-uk--england-and-wales--scotland-and-northern-ireland/2013/stb---mid-2013-uk-population-estimates.html - or download from here
There are 51 police forces in England, Scotland and Wales. The London Metropolitan and City of London Police areas are combined here to give an area very similar to that covered by TfL (the only difference being whether Heathrow Airport is included). This has been done because the City of London police area has a very small population and comparisons would not be meaningful. This gives 50 police areas for comparison.
Road casualties are classified into three levels of severity: (a) killed, (b) seriously injured, and (c) slightly injured. It is thought that almost all fatal injuries are reported to the police and so appear in the STATS19 database, and also that most seriously injured casualties are reported to the police. However, it seems that only a minority of slightly injured casualties are reported. So this comparison of police areas was done of the total of killed and seriously injured (KSI) casualties.
The analysis done gives the rate of reported KSI casualties per 100,000 population, and so does not take into account the influx into an area of commuters and visitors. It would be better to analyse the casualty rates per billion kilometers walked in each area, but accurate walking data is not available. However it seems very unlikely that the large differences in pedestrian casualty rates between police areas can be explained by differences in numbers of visitors and commuters.
The possible influence of year-to-year random variation is shown on the charts by confidence intervals. For information on confidence intervals, see www.travelindependent.org.uk/confidence_intervals.html .
For, charts and tables for each police force area, see www.travelindependent.org.uk/casualties_by_police_area.html.