
Local authorities ranked by pedestrian casualties
This section gives a comparison, for the different local authorities in the UK, of pedestrian casualty rates for (1) all ages, and (2) child pedestrians. Sources and notes are given after the charts. For charts and tables for each local authority, see www.travelindependent.org.uk/casualties_by_highway_area.html .
In summary
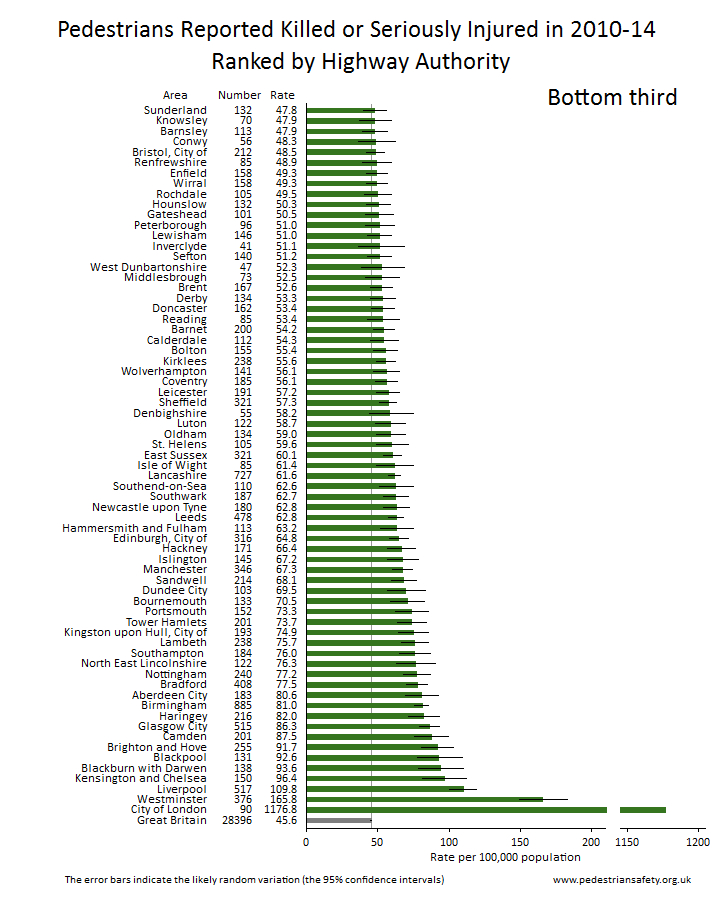
- the worst local authority areas have pedestrian casualty rates about twice the national average
- the best local authority areas have casualty rates about half the national average
- so there is a 4:1 overall variation from the worst to the best.
Worst local authority areas | |
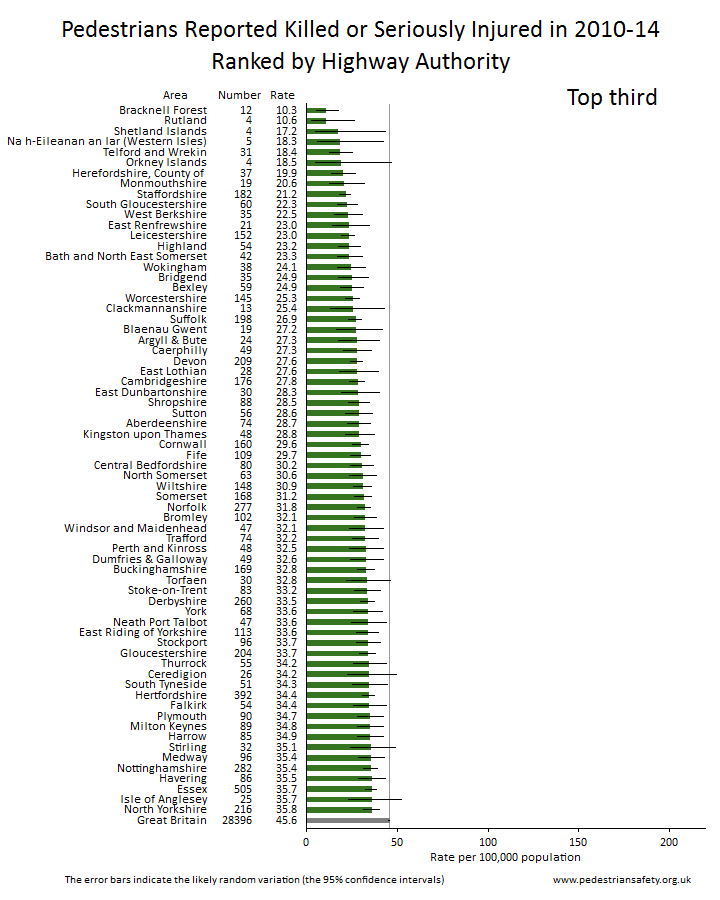
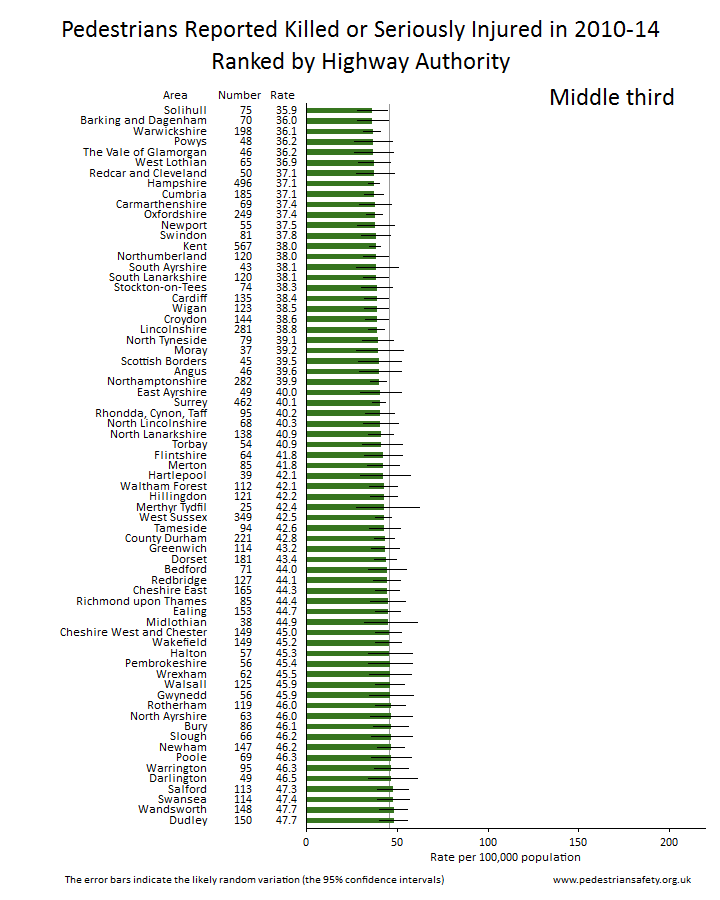
Pedestrian casualties - all ages
| Child pedestrian casualties
|
| The rankings are according to the rate of reported killed or seriously injured (KSI) pedestrian casualties per 100,000 population (or per 100,000 children respectively) for the five-year period of 2010-14. 'Children' includes the age range of 0 - 15 years. | |
The full rankings are given below - the first set of three charts are for the all-ages total, and the second set of three charts for child pedestrians.
Comment
There are a number of reasons why one local authority area may have a pedestrian casualty rate below the best areas, and so a lower ranking for an authority does not necessarily imply fault. However it does suggest that a check should be made that it is adhering to best practice for reducing danger to pedestrians.
The analysis done compares the rate of reported KSI casualties per 100,000 population, and so does not take into account the influx into an area of commuters and visitors. It would be better to analyse the casualty rates per billion kilometers walked in each area, but accurate walking data is not available. The influx of commuters and visitors into the City of London is likely to explain most and perhaps all of its high rate per 100,000 population. The same may be true for Westminster, but in other cases it seems very unlikely that the large differences in pedestrian casualty rates between local authorities can be explained by differences in numbers of visitors and commuters.
Pedestrian casualties - all ages
Child Pedestrian casualties
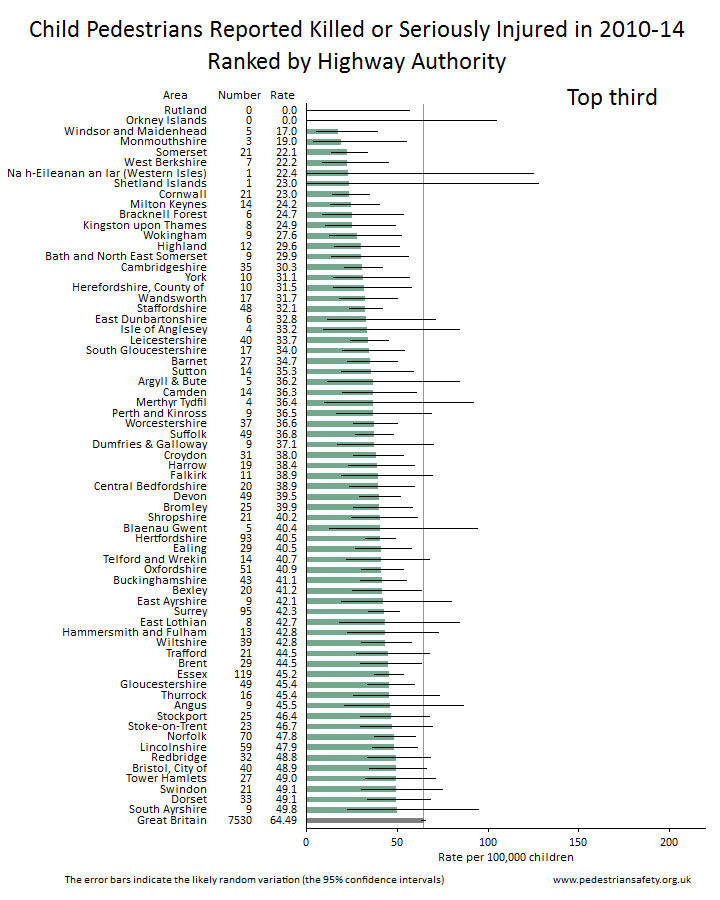
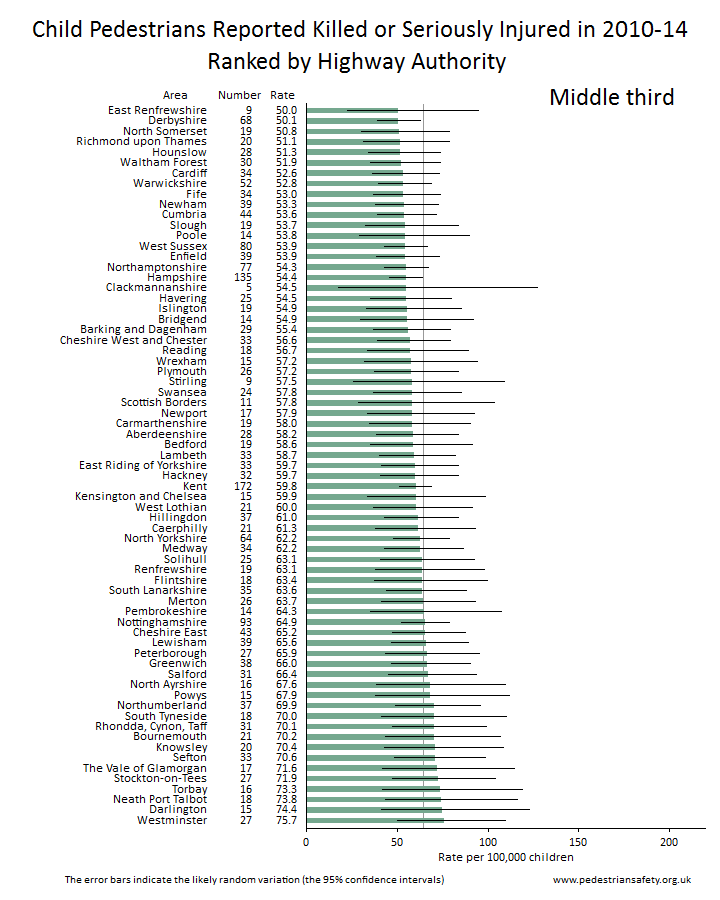
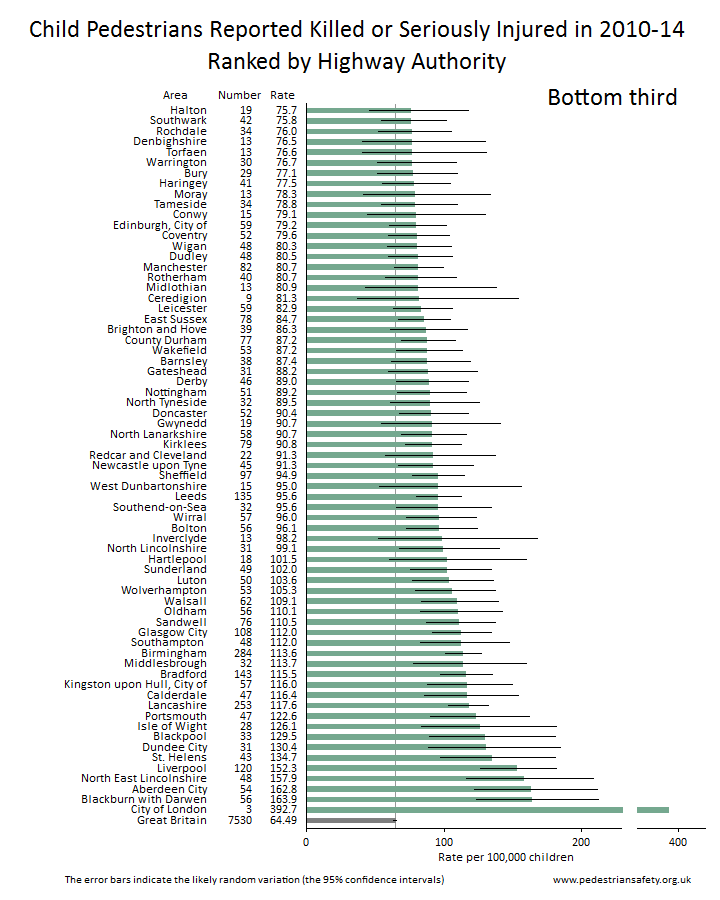
'Children' includes the age range of 0 - 15 years.
Sources and notes
These analyses are derived from the DfT database of road collisions, casualties and vehicles (the police/DfT STATS19 database).
The data broken down by local authority and year can be viewed in spreadsheets published by the DfT in .xls format, see https://www.gov.uk/government/uploads/system/uploads/attachment_data/file/10184/ras30043.xls - or download from here.
The population data was taken from Population Estimates for UK, England and Wales, Scotland and Northern Ireland, Mid-2013 published by the Office for National Statistics http://www.ons.gov.uk/ons/rel/pop-estimate/population-estimates-for-uk--england-and-wales--scotland-and-northern-ireland/2013/stb---mid-2013-uk-population-estimates.html - or download from here
The local authorities compared were the 207 highway authorities i.e. those with responsiblity for highways. Heathrow Airport and the Scilly Islands were excluded leaving 205 areas for comparison.
Road casualties are classified into three levels of severity: (a) killed, (b) seriously injured, and (c) slightly injured. It is thought that almost all fatal injuries are reported to the police and so appear in the STATS19 database, and that most seriously injured casualties are reported to the police. However, it seems that only a minority of slightly injured casualties are reported. So this comparison of local authorities was done of the total of killed and seriously injured (KSI) casualties.
For information on confidence intervals, see www.travelindependent.org.uk/confidence_intervals.html .
For charts and tables for each local authority, see www.travelindependent.org.uk/casualties_by_highway_area.html.