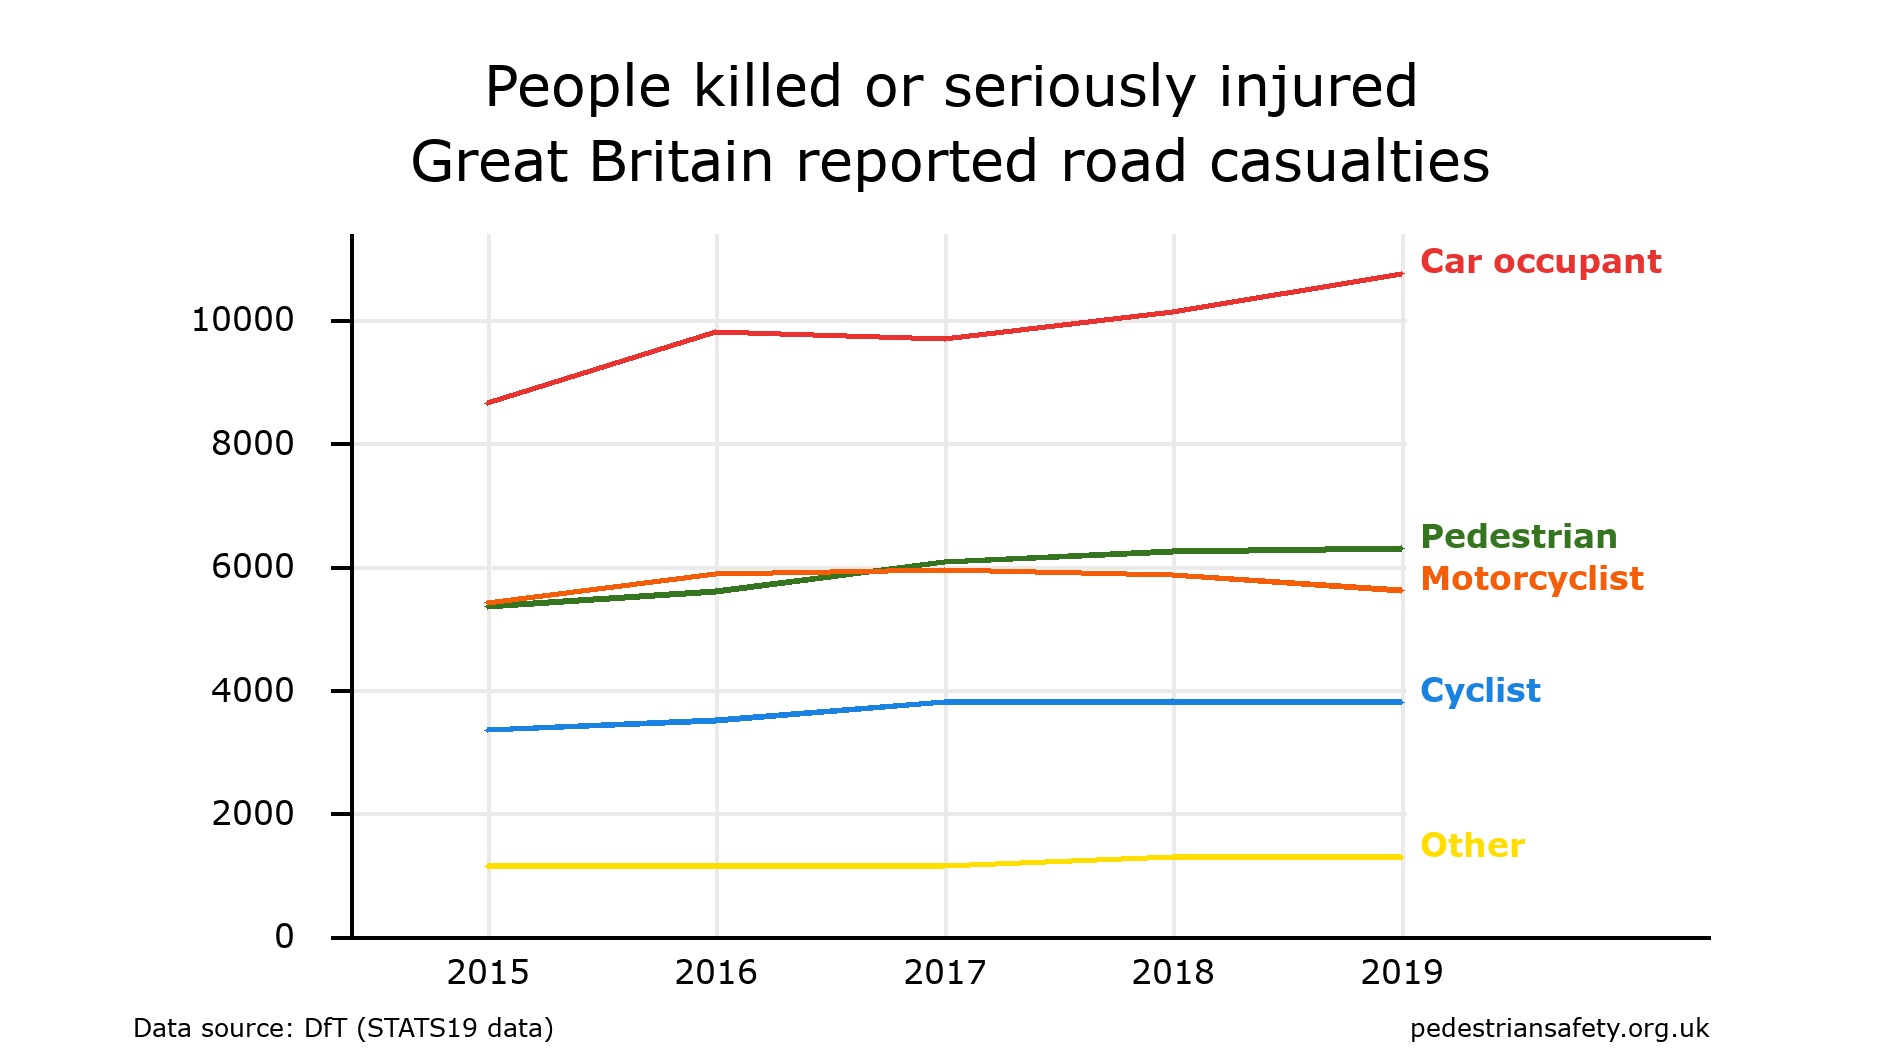
Make charts and tables from the DfT road casualty databases.
Right-click on the chart to download it. Charts are free of copyright.

Save/share this analysis
| Great Britain reported road casualties: People killed or seriously injured | ||||||
|---|---|---|---|---|---|---|
| Year | Pedestrian | Cyclist | Motorcyclist | Car occupant | Other | Total |
| 2015 .csv | 5348 | 3339 | 5407 | 8642 | 1138 | 23874 |
| 2016 .csv | 5588 | 3499 | 5872 | 9791 | 1143 | 25893 |
| 2017 .csv | 6064 | 3799 | 5941 | 9681 | 1138 | 26623 |
| 2018 .csv | 6238 | 3806 | 5851 | 10115 | 1284 | 27294 |
| 2019 .csv | 6284 | 3795 | 5604 | 10738 | 1276 | 27697 |
| 2015 - 2019 | 29522 | 18238 | 28675 | 48967 | 5979 | 131381 |
The meanings of the variable names and codes are given in the DfT file: road-accidents-safety-data/variable lookup.xls .